

One or two tails?

By Guillaume Filion, filed under
statistics,
p-hacking.
• 11 December 2016 •
") Here is a discussion that I recently had with my colleague John. He approached me with the following request:
Here is a discussion that I recently had with my colleague John. He approached me with the following request:
“I sent a manuscript to Nature and it is going quite well. Actually the reviewers are rather positive, but one of them asks us to justify better why we used a one-tailed t test to find the main result. What should I write in the methods section?”
“It depends. Why did you use a one-tailed t test?”
“Well, we first tried the standard t test, but it was borderline significant. My student realized that if we used the one-tailed t test, the result was significant so we settled for this variant. We specified this clearly in the text, and I am now surprised that I have to justify it. Isn’t it just an accepted variant of the t test?”
“To be honest, I understand your confusion. The guidelines are rather ill-defined. Actually, Nature journals make it worse by requesting this information for every test, even for those that are only one-tailed like the chi-square.”
“OK, but what should I do now? For instance, how do you justify using a one-tailed t test?”
“I can’t remember using a one-tailed t test in an article.”
“Really... Why?”
“If anything, because it is hard to justify. Perhaps an example will help. Imagine that I want to prove that male crocodiles are bigger than females. I set up a one-tailed t test and it turns out that females are a whooping thirty percent bigger than males. What is my conclusion?”
“I guess you conclude that females are actually bigger.”
“Wrong. I conclude that females have exactly the same size as males.”
“But you just told me that they are bigger!”
“Yes, and I also told you that I am doing a one-tailed t test.”
“That does not make any sense. Why can’t you change your hypothesis and test again?”
“I sure can. But what was the point of that one-tailed test then?”
“OK, I see what you mean. In case you are initially biased towards the wrong conclusion, the one-tailed test won’t help you realize it. But this is not what we did. We were not biased because we first looked at the data and only then did a one-sample test.”
“Exactly. And this is where things get more complicated. To cut a long story short, the theory of statistical tests assumes that looking at the data is the last thing you do. You first choose the test, choose the number of tails, the sample size etc. Then you collect the data and do the test.”
“You must be kidding... Who does that?”
“Nobody, especially not me. But by avoiding one-tailed t tests, I am doing myself a favor because I test the same data only once.”
“I remember your warnings about p-hacking, I get your point. But surely one-sided tests exist for a reason. They cannot be just bad, can they?”
“Of course. I can think of at least three cases where I would use a one-tailed test.”
“Is any of those related to my case?”
“Nope. I am sorry John.”
“Well, thanks for your help anyway. You will tell me about this another time. Right now I need to find a solution for my problem.”
The danger of John’s approach
John claimed that there is no bias when first looking at the data, and then doing a one-tailed test. This is incorrect. To see this, I have generated random Gaussian data sets on which I have performed a one-tailed t test. As John suggests, I have changed the side of the tail depending on whether the first or the second sample had the greatest mean. I then recorded how many tests had a p-value lower than 0.05. Here is what it looks like for different sample sizes.
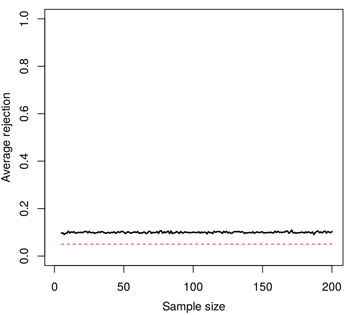
I have highlighted the 0.05 threshold by a red dotted line. The rejection rate of this procedure lies nicely above the horizontal line for all sample sizes. The theoretical value of the black line is 0.10, can you see why?
When performing a t test on random data (i.e. when the null hypothesis is true), the t statistic will be positive or negative with probability 1/2. The procedure described above is equivalent to swapping the samples such that the t statistic is always positive. If we call $(Q_{95})$ the 95-th percentile of the t distribution, the value we are looking for is $(P(t > Q_{95} | t > 0))$. But this is simply
$$P(t > Q_{95} | t > 0) = \frac{P(t > Q_{95} \cap t > 0)}{P(t > 0)} = \frac{P(t > Q_{95})}{1/2} = 2P(t > Q_{95}).$$
In conclusion, this approach doubles the risk of rejecting the null hypothesis when it is true. More worrisome, a risk of 0.10 will be claimed to be 0.05.
If you would like to see the code to generate the simulation, click the Penrose triangle below.
# Define a modified one-tailed t-test that first looks at the data
# and then decides which alternative to use.
cheat_test <- function(x,y) {
   alt <- ifelse(mean(x) < mean(y), "less", "greater")
   t.test(x,y, alternative=alt)$p.value
}

# Create a vector to store the average rejection rate.
# We vary the sample size from 5 to 200 in this example.
av <- rep(NA, 200)
for (ssize in 5:200) {
   # We perform 1000 replications of the test (increase
   # if you want more accuracy).
   pvals <- replicate(1000, cheat_test(rnorm(ssize), rnorm(ssize)))
   av[ssize] <- mean(pvals < 0.05)
}
When to use one-tailed tests?
I can see at least three cases where one-tailed tests are appropriate. I am sure that some would disagree, or find the list incomplete. I simply hope that these examples will help you make your own judgement.
1. Asymmetric distributions
Some tests are intrinsically one-tailed. The $(\chi^2)$ test for instance has a positive distribution with a right tail. A large value means a departure from expectations, so the rejection region is put exclusively on the side of large values. This way, the null hypothesis is not rejected when the scores have expected values.
A famous counterexample is found in the reanalysis of Mendel’s results by Fisher. The key argument of Fisher was that the values of the $(\chi^2)$ statistics were too small and thus that the samples were too much as expected, which he found suspicious. This usage of the $(\chi^2)$ test is rather unconventional, but it is still one-tailed.
I find the fact that Nature journals ask to specify the number of tails in the $(\chi^2)$ test rather confusing. This may lead some readers to believe that a two-tailed $(\chi^2)$ test is also sound.
2. Composite null hypotheses
This is rather a hack than an argument based on theory. The vast majority of null hypotheses are “simple” in the sense that they are true for a single value of the parameter under study (typically when it is equal to 0). This is rather problematic because we would sometimes like to test whether the mean is non-negative instead of just zero. In practice, it makes sense to achieve this with a one-tailed test for the null hypothesis that the mean is zero.
3. We measure only one tail
Sometimes, it is too costly or impossible to measure some events at one of the ends of the distribution. For instance, imagine that a company is testing new hardware components supposed to be more resistant to failure. To do so, they run their prototypes for months until failure, in parallel with current hardware as a control. If the prototypes fail before the current hardware, there is no point wasting time and resources to see how much better the current hardware is. This tail will never be observed, so the company might as well set up a one-tailed test.
One might argue that many cases fall in this category because the main point is that one of the possible outcomes is simply not “interesting”. For instance, is it really worth to discover drugs that are less efficient than the placebo? Or fortune tellers performing significantly worse than random? Here it depends on the context, but either way, this decision should be taken before having a look at the data.
« Previous Post | Next Post »
blog comments powered by Disqus