(Mis)using the KS test for p-hacking
By Guillaume Filion, filed under
p-hacking,
statistics.
•
•
A colleague of mine (let’s call him John) recently put me in a difficult situation. John is a very good immunologist who, as nearly everybody in the field, had to embrace the “omics” revolution. Spirited and curious, he has taken the time to look more closely into statistics and he now has an understanding of most popular parametric and nonparametric tests. One day, he came to me with the following situation.
“I have this gene expression data, you see... I know that a gene is up-regulated, but it is just not significant.”
“What do you mean not significant? What test did you use?”
“I used the Wilcoxon test. I have five replicates in each condition, and without proof that the distribution is approximately Gaussian, I have been told to use a nonparametric test.”
“I agree, that’s probably safer. Well John, that sucks, it means that you have to do the experiment again.”
“But I can’t. This was patient material. This is all the data I have and I cannot get more. Is there a way to boost the significance of the test?”
“I see... I already told you about p-hacking, right? You know that this is not a good practice to change test or remove outliers until you get a significant p-value.”
“Yes of course, I know. But here it is different. There is tons of evidence that this gene should be up-regulated, and the trend is definitely there in my data. And like I said, this is patient material. It cost some people a lot of time and a lot of money to get it.”
“Let me think about it.”
I felt sorry for John, even more so because I really did not know what to do. The following week I met him in the corridors and he looked much less worried.
“It’s solved! he approached me.”
“Really? Well, I am very happy to hear that. How did you do it?”
“I used the Kolmogorov-Smirnov test instead, and it is significant!”
“The Kolmogorov-Smirnov test? Well, I am surprised. I don’t see how you can use it to test up-regulation.”
“Yes, I was also surprised. But the idea is very simple and genius. I read it in a recent Science paper, the trick is to use the sign of the KS score. In one case it is up-regulated, in the other it is down-regulated, and if the test is not significant then there is no difference.”
The signed KS test
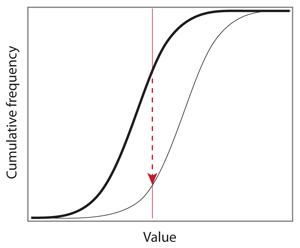
Very simple, and genius indeed. But completely wrong. Let’s see why the Kolmogorov-Smirnov test should not be used to draw this kind of conclusion. First, remember that the KS test is used to decide whether it is likely that two samples are drawn from the same distribution. More specifically, the null hypothesis is that two samples come from the same distribution and that sampling is IID (independent and identically distributed). The testing procedure is to plot the empirical distributions on top of each other, and compute the score of the test (the test statistic) as the maximum vertical distance between the two.

The ideal example above shows the principle of the test and how to compute the vertical distance between two empirical distributions. John’s idea is that the direction of the arrow, up or down, indicates whether the thin curve is on the left or on the right of the bold curve. In this case, the thin curve is shifted to the right, so the values associated with this distribution are typically higher than the values associated with the bold curve. If the thin curve was on the other side, the arrow would be pointing upward and the sign of the test statistic would be opposite.
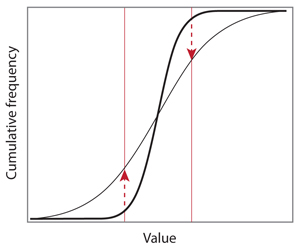
However, the reality can look quite different, and it usually does. Below is another ideal example where it is hard to tell whether the thin curve is on the left or on the right of the bold line. The maximum vertical distance is achieved on two occasions, but the arrows points in opposite directions.

In this case, the two distributions differ by their spread, or their variance. With a large enough sample size, the conclusion of the KS test will be that the null hypothesis should be rejected, but the sign of the score is meaningless here. In addition, the probability that it is positive or negative is exactly 1/2.
The boost in statistical power that John obtained is not a miracle. It comes from the fact that the alternative hypothesis has changed, but he did not acknowledge it. In the Wilcoxon-Mann-Whitney test, the alternative hypothesis is that the values of one distribution tend to be higher than the values of the other (a.k.a. stochastic dominance). In the KS test, the alternative hypothesis is that the distributions are different. As the example above shows, there are many ways the curves can differ but John can choose only among two options, up-regulation or down-regulation. For John’s question and the conclusions that he wants to draw, the Wilcoxon test is the most appropriate.
What did my colleague John do, then? The good news is that he does not really exist. The bad news is that the Science paper he talked about is real[1], and that there are other high profile papers out there propagating the misconception[2-5].
References
- Immunogenetics. Chromatin state dynamics during blood formation. Science. 2014 Aug 22;345(6199):943-9.
- Elevated rates of protein secretion, evolution, and disease among tissue-specific genes. Genome Res. 2004 Jan;14(1):54-61.
- FatiGO +: a functional profiling tool for genomic data. Integration of functional annotation, regulatory motifs and interaction data with microarray experiments. Nucleic Acids Res. 2007 Jul;35.
- Altered brain microRNA biogenesis contributes to phenotypic deficits in a 22q11-deletion mouse model. Nat Genet. 2008 Jun;40(6):751-60.
- Epigenetic polymorphism and the stochastic formation of differentially methylated regions in normal and cancerous tissues. Nat Genet. 2012 Nov;44(11):1207-14.